Update: Google Sheets now has conditional formatting built in, so this script is not needed anymore; leaving it here for reference.
I love a feature in Excel (never thought I’d say that!) where I can choose a range of data and have Excel colour the backgrounds of the cells from red to green or green to red based on the cell’s value in the selected range. Excel calls this “Conditional formatting” and while Google Spreadsheets has a feature that has the same name, it’s really a completely different thing and it’s driving me nuts. But it has scripting, so I had to fix this lack of functionality.
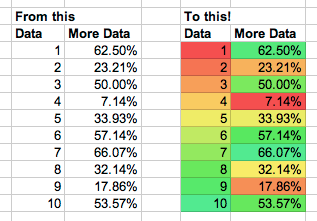
To install this script, open your spreadsheet, open Script editor… in the Tools menu. Paste the source in and save. Then reload the actual spreadsheet. You should now have a new menu in your toolbar called ColourTool, with two options to colour cells. Choose the range you want to colour, choose an option and tada, your cells change background colour.
Note: This has not been tested extensively. There’s no code here to change the actual data, but, use at your own risk.
(Apologies for WordPress doing things to code formatting!)
function onOpen() {
var ss = SpreadsheetApp.getActiveSpreadsheet();
ss.addMenu("ColourTool", [ {name: "High is Green, Low is Red", functionName: "hiToLow"},{name: "High is Red, Low is Green", functionName: "lowToHi"}]);
}</p>
<p>function hiToLow() { colourCells(1); }
function lowToHi() { colourCells(2); }</p>
<p>function colourCells(mode) {
var s = SpreadsheetApp.getActiveSheet();
var r = s.getActiveRange();
var rows = r.getNumRows();
var cols = r.getNumColumns();</p>
<p>var minV =  9007199254740992;
var maxV = -9007199254740992;</p>
<p>for(var i = 1; i < = cols; i++) {
for (var j = 1; j <= rows; j++)
{
var value = r.getCell(j,i).getValue();</p>
<pre><code>  if(value !== "")
  {
    minV = Math.min(value, minV);
    maxV = Math.max(value, maxV);
  }
}
}
for(var i = 1; i <= cols; i++) { for (var j = 1; j <= rows; j++) {
var val = r.getCell(j,i).getValue();

var percent = (val - minV)/(maxV-minV);

  if (mode == 2) { percent = 1-percent; }

  var colour = getColor(percent);
  r.getCell(j,i).setBackgroundRGB(colour[0],colour[1],colour[2]);

  }
} }
function getColor(power) { var H = power * 0.4; var S = 0.9; var L = 0.6;
return hslToRgb(H,S,L);
}
function hslToRgb(h, s, l){ var r, g, b;
if(s == 0){
    r = g = b = l; // achromatic
}else{
    function hue2rgb(p, q, t){
        if(t < 0) t += 1;
        if(t > 1) t -= 1;
        if(t < 1/6) return p + (q - p) * 6 * t;
        if(t < 1/2) return q;
        if(t < 2/3) return p + (q - p) * (2/3 - t) * 6;
        return p;
    }

    var q = l < 0.5 ? l * (1 + s) : l + s - l * s;
    var p = 2 * l - q;
    r = hue2rgb(p, q, h + 1/3);
    g = hue2rgb(p, q, h);
    b = hue2rgb(p, q, h - 1/3);
}

return [r * 255, g * 255, b * 255];
}
Leave a Reply